The backtest killer nobody talks about: human leakage
Every retail trader learns about look-ahead bias, survivorship bias, and overfitting. There's one more bias that contaminates strategies passing every standard robustness check, and it lives in your head, not your code.
Every retail algo trader learns about the standard backtest biases early. Look-ahead bias, where a feature accidentally sees the future. Survivorship bias, where your universe excludes stocks that got delisted. Data quality issues, where the numbers you’re testing on aren’t the numbers that traded. Overfitting, where you tuned parameters until the equity curve looked pretty.
There’s one more bias that’s much harder to see, and it contaminates strategies that pass every standard robustness check. I call it human leakage. It’s the bias that comes from you having looked at the chart before writing the strategy.
Here’s the scenario. You’re staring at SPY on a Tuesday afternoon. You notice something interesting. Every time SPY touches the 200-day moving average from above during an uptrend, it bounces. You count. Six times in the last two years. All six were tradeable. You get excited. You go home and code up “buy SPY on 200-day touch, sell on 5-day EMA cross.” You backtest. Beautiful. Walk-forward validation. Still beautiful. Purged cross-validation. Still positive. You paper trade for three months. It works. You go live with real money.
Six months later you’re down 12% and confused. The backtest was rigorous. What went wrong?
You went wrong. Specifically, you looked at the chart before you wrote the rule.
What human leakage actually is
Machine leakage is when your data pipeline accidentally lets future information leak backward into the features that generate signals. You compute a rolling z-score using the full-sample mean instead of an expanding window. You use tomorrow’s open on today’s bar. You accidentally shift a return column by -1 instead of +1. These are code bugs. You can find them and fix them.
Human leakage is different. It’s not in the code. It’s in your head. You designed the rule after already having seen the outcome the rule is predicting. The rule can’t help but “know” the answer, because the answer is what made you notice the pattern in the first place.
Every backtest bias framework I’ve seen treats you, the researcher, as if you were sitting in a sealed room encountering the data for the first time. In that fantasy, you form a hypothesis a priori, then test it against unseen data, and the OOS Sharpe is a genuine measurement of whether your hypothesis had signal.
That’s not what happens. You’ve been staring at charts for years. You’ve read every retail-visible pattern that gets discussed on YouTube and Reddit. Your brain has already run a massive pattern-matching pass over the data you’re now backtesting. When you “notice” something interesting, you’re pulling from an internal cache of prior observations that already knows what worked.
Why standard bias checks don’t catch this
Walk-forward validation, combinatorial purged cross-validation (CPCV), embargo periods, all of these techniques are designed to catch machine leakage. They ensure that no feature value used to generate a signal at time T incorporates information from T+1 or later. They’re mathematically airtight against the class of bias they were built for.
None of them detect human leakage, because the bias isn’t in the features. It’s in your choice of which rule to test in the first place.
Think of it this way. Imagine there are one thousand possible trading rules you could have coded up: SPY bounces off the 200-day, SPY reverts to the 50-day EMA, SPY gaps down on Mondays, SPY rallies before Fed announcements, on and on. Random noise means that roughly ten of those thousand will show statistically significant OOS Sharpe just by chance. Of the ninety percent that don’t work, most look boring on a chart and you’d never bother to test them.
The ten that show significant OOS Sharpe are the ones you noticed. You noticed them because they showed a pattern. And the pattern is what your OOS test is measuring. Circular.
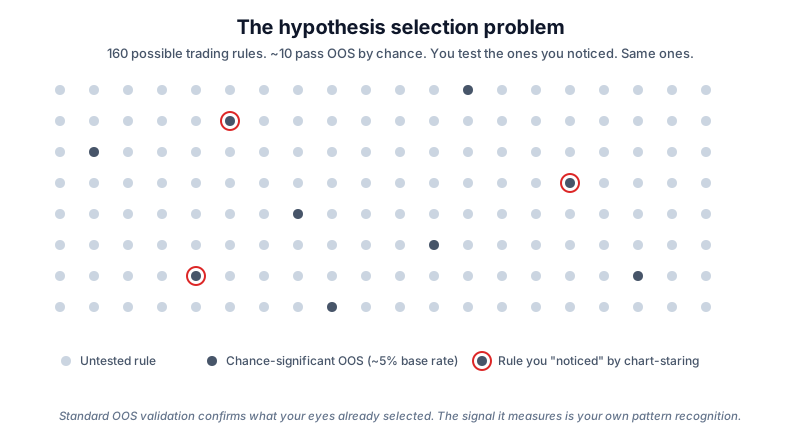
The mathematical name for this in academic statistics is “researcher’s degrees of freedom,” documented in the 2011 paper by Simmons, Nelson, and Simonsohn. In physics it’s called Bonferroni error, referring to failure to adjust for the number of hypotheses tested. In finance, López de Prado calls it “backtest overfitting” and shows how it inflates Sharpe by often 2x or more. It’s the same phenomenon under different labels. The space of hypotheses is enormous, and you selected yours based on already having seen which ones work.
Three examples of how it happens
Example one, the seasonal pattern. You notice that some tech stocks tend to rally into January. You code up a “buy XLK on December 20, sell January 10” rule. Backtest twenty years. Positive Sharpe, 0.6. Not spectacular but real. Walk-forward validation with a five-year training window and one-year OOS. Still positive.
What went wrong? The January effect is one of the most-discussed retail patterns in finance. It’s been in academic papers since 1976. Every financial newsletter has covered it. You didn’t discover this in December 2024 by staring at charts. You absorbed it through decades of ambient exposure. Your “discovery” was really recognition.
If the effect were still tradeable at retail scale, institutions would have already arbitraged it out. Its survival in the backtest is either because you’re testing on the same data everyone else tested (and it looks like signal because everyone believes in it), or because you’re picking parameters (December 20, not December 15) that maximize in-sample fit.
Example two, the day-of-week pattern. You notice on Reddit that Wednesday selloffs are common. You code up a “sell short QQQ on Wednesday open, cover Friday close” rule. Backtest six years. Positive Sharpe.
Sounds legitimate. But it’s not just that you noticed Wednesday selloffs. It’s that your brain has been sampling Wednesday QQQ moves for years, and the ones that stuck were the negative ones. The positive Wednesday returns are invisible to you because they didn’t fit the pattern you were looking for. Your “hypothesis” was already selected by biased memory sampling.
Test it. Apply the exact same rule to EEM or DXY or Bitcoin. If your Wednesday hypothesis has any generalizable signal, it should show up (weakly, but positively) in other asset classes with similar retail participation. If it doesn’t, you were fitting your memory, not market structure.
Example three, the “obvious” post-earnings drift. You notice that stocks that beat earnings tend to keep going for weeks. You code up “long any stock with a positive earnings surprise > 5%, hold 30 days.” Backtest fifteen years. Positive Sharpe.
Post-earnings announcement drift (PEAD) is one of the most-studied academic anomalies in finance. There are hundreds of papers on it. Hedge funds have entire strategies built around exploiting or fading it. The academic literature suggests the effect has been shrinking for two decades as more capital chases it.
Your backtest showing positive Sharpe on a well-known effect isn’t validation that your version of the rule has edge. It’s validation that PEAD existed at some point in your data window, which everyone already knew. The question is whether your specific implementation captures anything above and beyond what a naive implementation would have caught, and whether the edge survives 2025-2026 market microstructure.
You can’t unsee what you’ve seen
The natural response when you notice you’ve done this is to try to fix it. Get a fresh dataset. Add more OOS periods. Test on a different market. Use random universe selection.
None of these fully work. The core hypothesis is yours, and it was born from your prior observation. You can add noise around it (test on EEM instead of SPY, test on 4h instead of 1d, add random rotation of the trading calendar) and if the effect survives, some of the edge is probably real. But you can’t fully sanitize the fact that you’re the one who decided to test this hypothesis and not one of the other 999.
Multi-year gaps between discovering a pattern and deploying it don’t help either. Your brain doesn’t forget. If anything, the gap gives you more time to unconsciously refine the pattern by watching how it played out over the gap period.
The practical prescription
Given that you can’t fully eliminate human leakage, what can you actually do about it?
Prefer strategies you dreamt up rather than ones you found by chart-staring. If your hypothesis came to you in the shower, from reading academic literature, from a thought experiment about how a specific market participant should behave, or from a first-principles derivation, it’s less contaminated than one you noticed by looking at a chart. Not clean, but less dirty.
Write down your hypothesis before you look at data. This is the closest thing to a sealed-envelope test you can do at home. Commit in writing that you predict, say, stocks with high short interest and positive earnings surprises will outperform for 30 days. Then and only then run the backtest. If you look at the data first and then “write down” your hypothesis, you’ve already leaked.
Test the same rule on assets and timeframes you have never looked at. If you designed the rule on SPY daily, test it on TLT weekly, XLE hourly, and EEM daily. If it survives cleanly on three or four assets you have never mentally sampled, some of the edge is probably real. If it dies on any of them, you were probably fitting your own pattern recognition on the original asset.
Assume any strategy you “discovered” by chart-staring has 30-50% less edge than the backtest suggests. This is a heuristic, not a proof. But it’s a useful prior. Live trading will strip out the human-leakage portion of the edge, so a backtest showing Sharpe 0.8 might realize Sharpe 0.4-0.5 live, and a backtest showing Sharpe 0.4 might realize essentially zero. Size positions accordingly.
Prefer machine-generated hypotheses when possible. An LLM proposing a strategy from a feature dictionary hasn’t looked at the chart. It doesn’t know which combinations “should” work based on prior exposure. Its proposal space is broader and less biased by your specific historical exposure. This isn’t a full solution (the LLM has its own biases from training data) but those biases are different from yours and don’t correlate with your personal chart-staring history.
Why this affects AI-generated strategies less
AutoQuant’s AI Loop works by proposing trading strategies from a natural language description plus a feature dictionary. The LLM doesn’t see the historical chart. It doesn’t know that SPY 200-day bounces have been discussed on Reddit for a decade. It doesn’t have a prior belief about which patterns “should” work.
What it does have is training exposure to a vast corpus of finance and code writing. That gives it its own biases (it will over-suggest RSI-based rules because RSI is common in training text, for instance). But those biases don’t correlate with your biases. When the AI proposes a mean-reversion strategy on ADX regime, it’s not proposing it because you noticed ADX-regime mean reversion working last month. It’s proposing it because the concept exists in its training data.
This is close to a functional definition of “researcher who hasn’t seen the data” for a solo trader. The strategies the AI Loop generates get filtered through your standard backtest suite the same way any hypothesis would. But the selection of which hypothesis to test is done by a system that isn’t reading your mind.
That’s not a magic wand. Backtests still overfit. OOS still lies about live performance. But the failure mode of “I already knew this pattern worked before I tested it” is structurally reduced when the hypothesis generation is machine-driven from a specification, not human-driven from chart-staring.
The uncomfortable implication
Every insight you’ve ever had by watching markets is contaminated. That doesn’t mean you can’t trade discretionarily. It doesn’t mean intuition is worthless. It does mean that the confidence you have in patterns you’ve observed is inflated by the same mechanism that generates the pattern.
Traders who have done this for decades and are still profitable have usually developed some combination of three defenses: sizing conservatively enough that the human-leakage haircut doesn’t wipe them out, trading enough different markets that their bias is spread across a portfolio of contaminated hypotheses (some of which luck out), and constantly adapting because the specific patterns they see change, forcing continuous re-hypothesis generation.
The retail trader running a single algorithmic strategy on a single market rarely has any of those defenses. Which is why so many rigorously-backtested single-asset strategies flame out within a few months of going live.
If your backtest was rigorous and you’re still losing, this is probably the thing. Not overfitting to parameters. Not bad execution. Not bad luck. The hypothesis itself was contaminated at the moment you decided to test it, and no amount of downstream rigor can wash that out.
Try a hypothesis you didn’t dream up
AutoQuant’s AI Loop generates trading strategies from a description and a feature dictionary. If you want to see what strategy discovery looks like when the researcher hasn’t seen the chart, you can try it as part of the 14-day free trial at autoquant.ai. Bring your own thesis or start from a seed strategy and let the loop iterate against real market data.
The AutoQuant team
Subscribe to the AutoQuant blog
One post every Friday. Backtest thinking, options mechanics, and AI-assisted strategy discovery. No spam.