We gave our charts a copilot. Then we made it impossible for it to lie.
AutoQuant v0.9.12 ships Chart Copilot: ask for support and resistance and the chart draws itself. The LLM never touches a number. This is the architecture, and the two bugs we caught live that prove why prompt discipline is not enough.
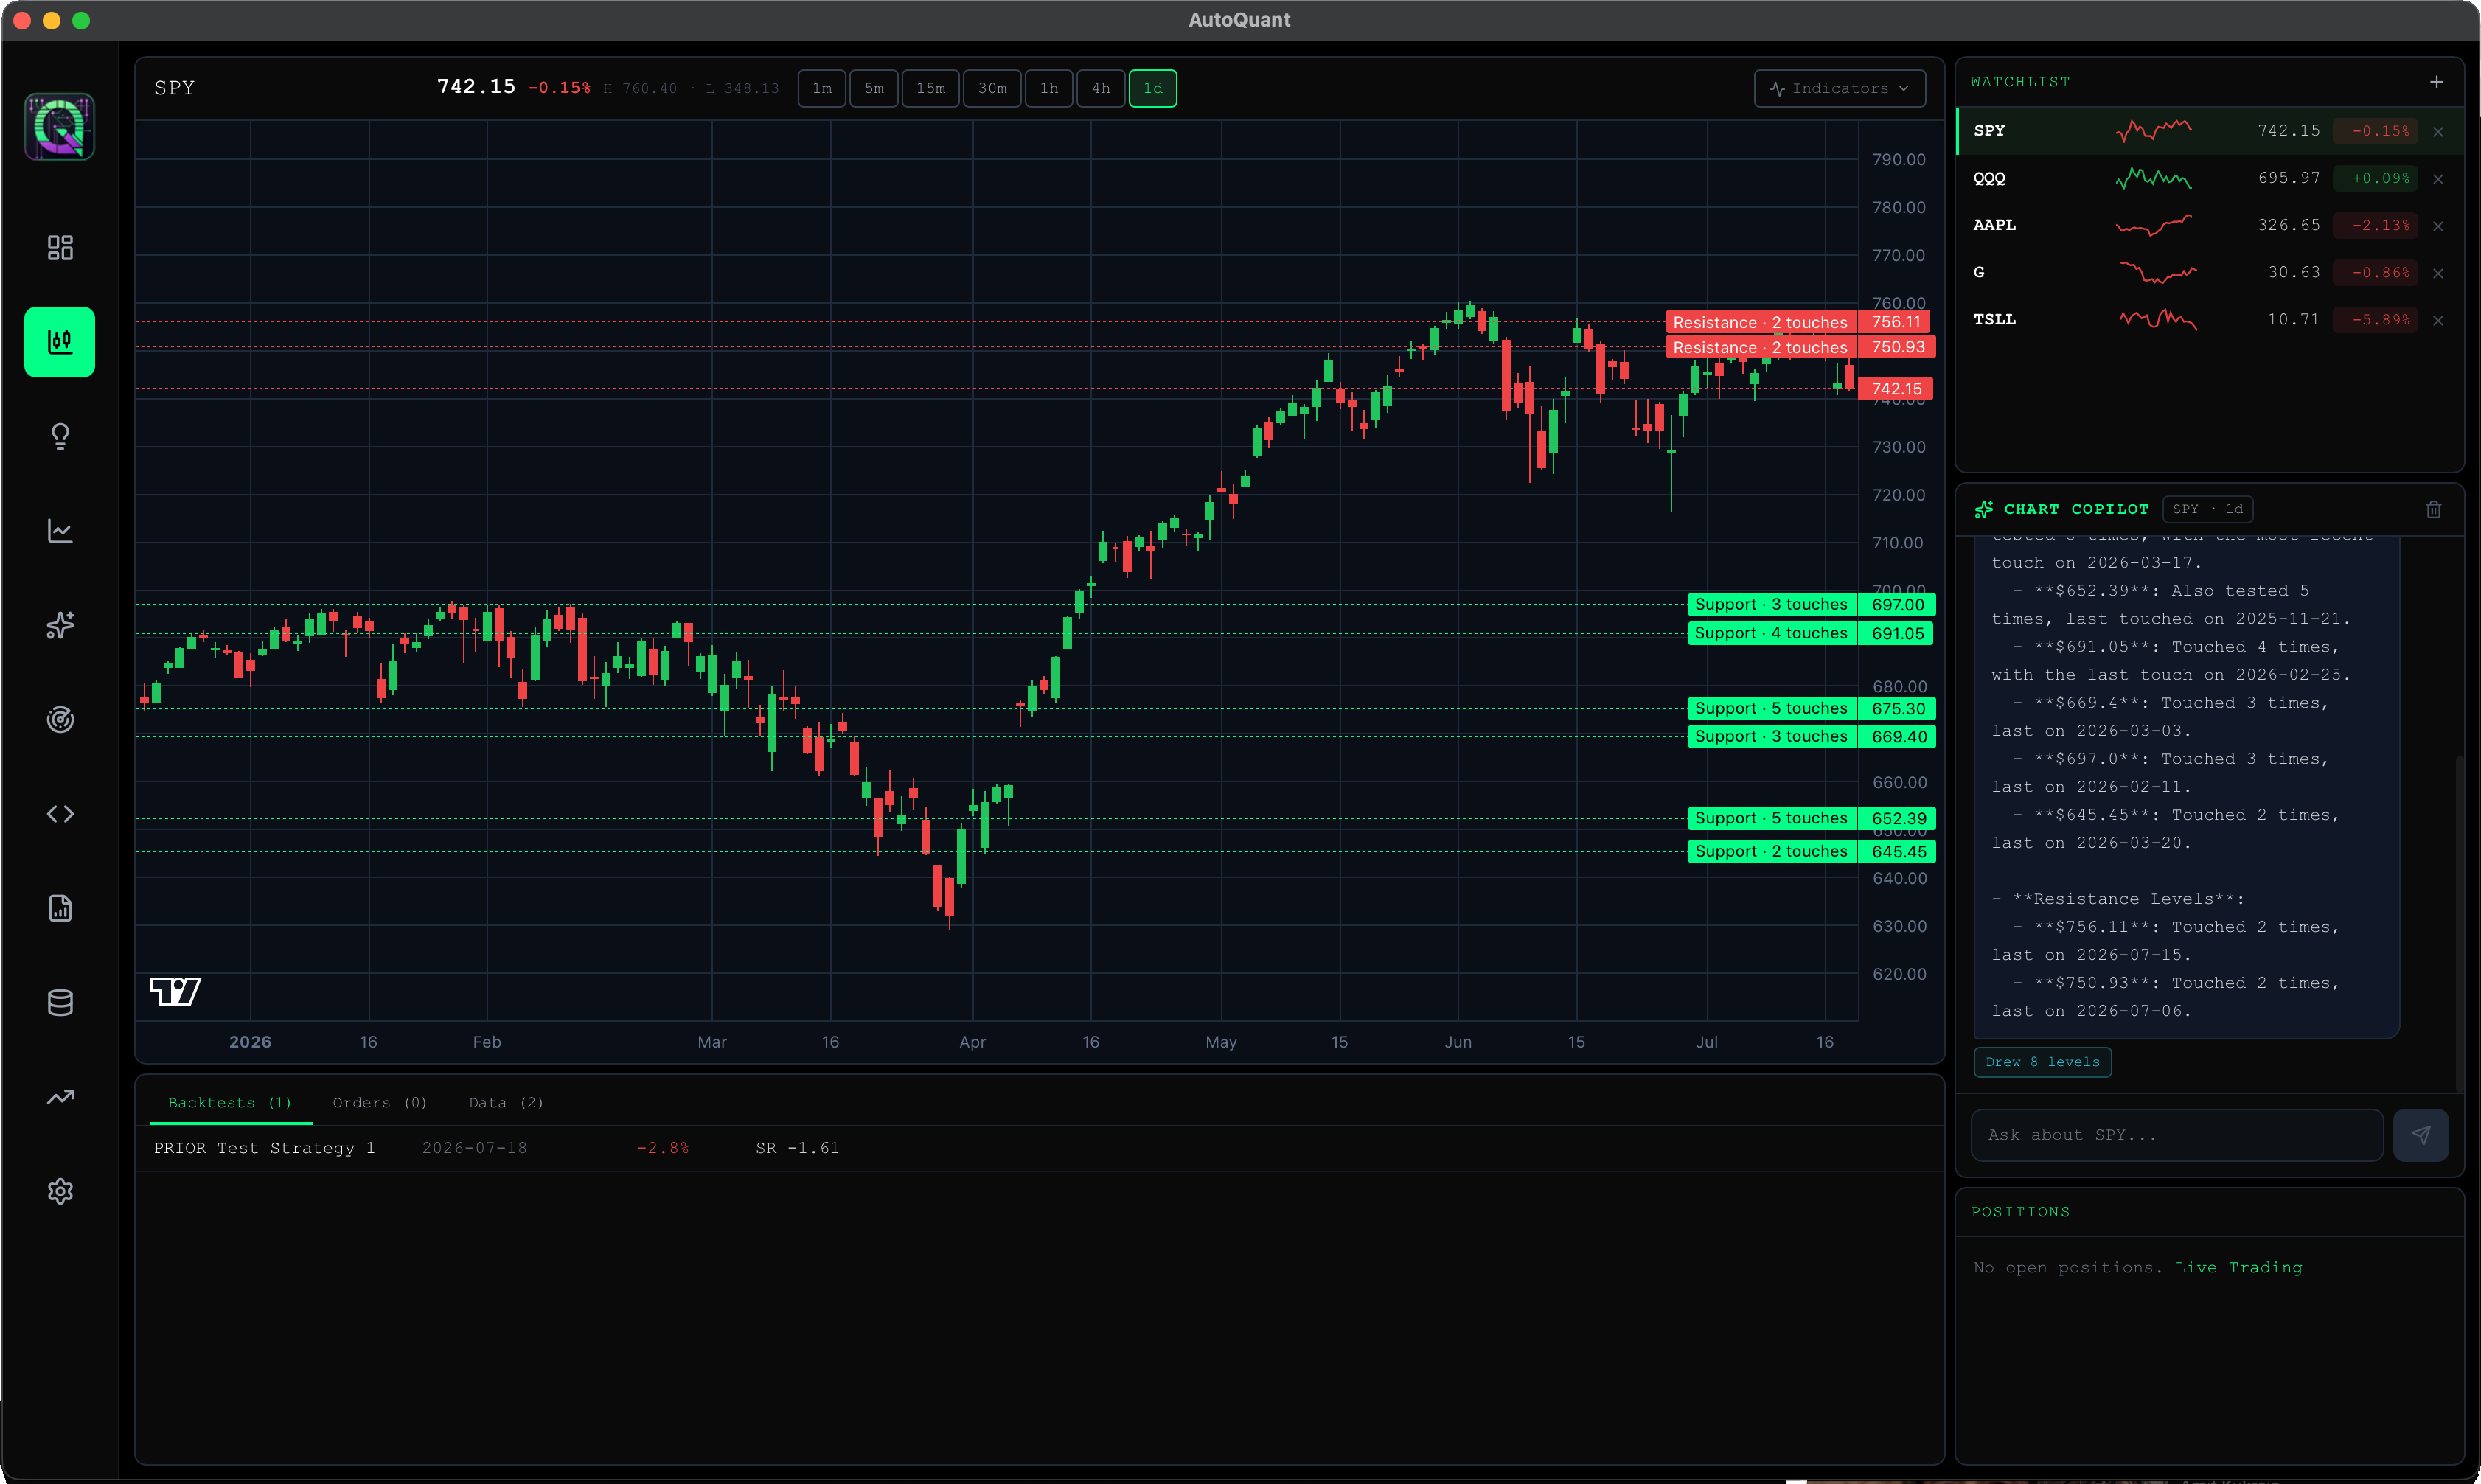
AutoQuant’s Charts page just got a copilot. You type “plot support and resistance” and the chart draws labeled levels. You type “add the 50 and 200 SMA” and they appear. You ask “mark the golden crosses” and arrows land on the real crossover dates. It shipped today in v0.9.12.
This post is about the part we care most about: making sure that when an AI draws a line on your chart, that line is real.
The rule that shaped everything
We’ve now built three AI features into AutoQuant, and all three run on the same rule. The model never invents a number. It picks setups for our Trade Ideas feed, but code computes the levels. It suggests option structures, but a deterministic resolver picks the strikes from the live chain. Chart Copilot is the third application, and the strictest one, because a hallucinated line drawn on a price chart looks exactly as trustworthy as a real one.
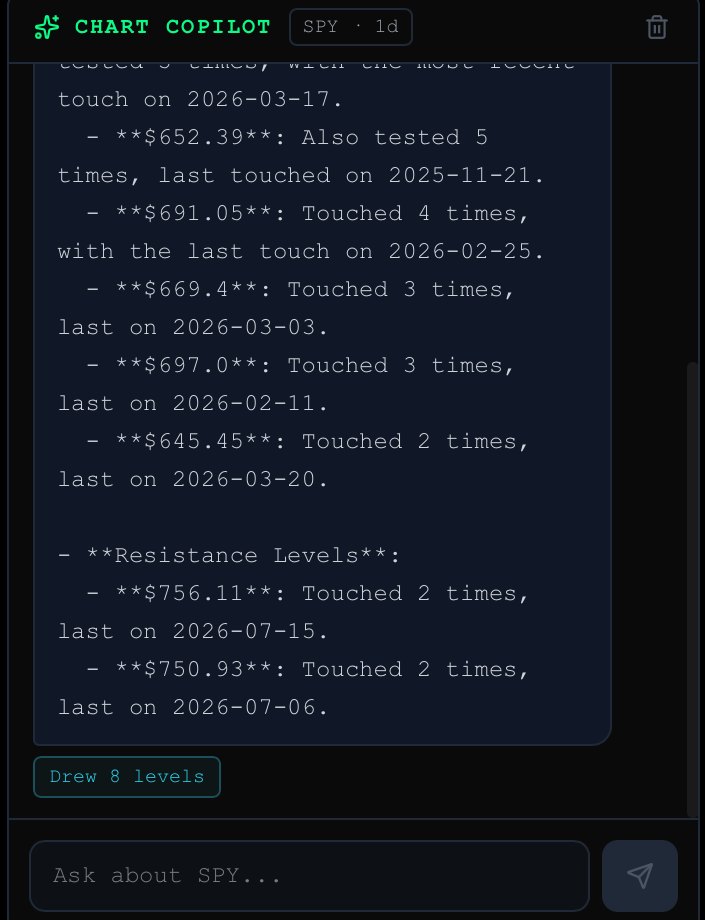
So the copilot cannot state a price. When you ask for support and resistance, the engine finds fractal pivots in the bars, clusters them with an ATR tolerance, and scores each level by how many times price touched it and how recently. The model receives those candidates, each with an id, and its only power is to reference ids. A validator checks every action it returns. If it tries to draw a level that isn’t in the computed list, the request is rejected and sent back for one repair attempt. The price that reaches your chart is attached server-side from the computed data, after validation, never from the model’s output.
The same applies to time. “Mark the golden crosses” works because the engine mechanically detects every 50/200 SMA crossover in the loaded data, and marker timestamps are validated against actual bars. In our testing the copilot marked a golden cross on 2023-02-02, which is a famous real one on SPY. It couldn’t have made that date up if it wanted to, because a made-up date fails validation.
And when it genuinely cannot know something, it says so. We asked it for SPY’s P/E ratio, which is nowhere in its chart context. It answered that it cannot provide that and pointed at fundamental data sources. A refusal is the correct output. We consider that a feature, and we test for it.
The two bugs that proved the design
We tested the copilot the way we test everything, by trying to break it live, and it broke twice. Both failures are more interesting than the feature.
First, conversational contamination. In one reply the model narrated that it would mark RSI oversold points “next”. There is no next. When the following user message arrived, asking for something completely different, the model executed its own earlier promise instead of the new request. We added prompt rules about answering only the newest message.
Then it happened again, worse. Asked to switch timeframes, the model repeated an earlier reply word for word and re-added indicators that were already on the chart, stacking a second RSI and a second MACD pane on top of the existing ones.
That second failure settled an argument we’d been having with ourselves. Prompt instructions are requests, and a model under a large context will sometimes ignore them. So we stopped asking and started enforcing. The server now has a repetition guard, which rejects any reply that matches an earlier assistant message, and a duplicate guard, which rejects adding an indicator that’s already active with the same parameters. Both trigger the same repair cycle as a fake price. Both have regression tests reproducing the exact live failures.
The lesson generalizes, and it’s the closest thing we have to a company motto now. The LLM proposes, code disposes. Every time we’ve shipped an AI feature, the reliability came not from a better prompt but from a validator that makes the failure unrepresentable.
What it runs on
Your own model. The copilot uses whatever LLM you’ve configured in AutoQuant’s settings, your OpenAI, Anthropic, or Gemini key, or a local model through Ollama. Your bars, your levels, and your conversations never touch our servers, because the whole thing runs inside the desktop app against your local data. That’s the same local-first posture as the rest of AutoQuant, and for a tool that looks at your trading, we think it’s the only acceptable one.
Drawings are scoped to the ticker and timeframe they were computed on. Levels found on daily bars belong to the daily chart. Switch to the hourly and you get a clean chart, switch back and your drawings are waiting. Ask on another ticker and the copilot follows you there, because it always reads the chart you’re actually looking at.
Chart Copilot is live in AutoQuant v0.9.12, out today at autoquant.ai/download.
Subscribe to the AutoQuant blog
One post every Friday. Backtest thinking, options mechanics, and AI-assisted strategy discovery. No spam.